Gates Foundation
Disease Charts
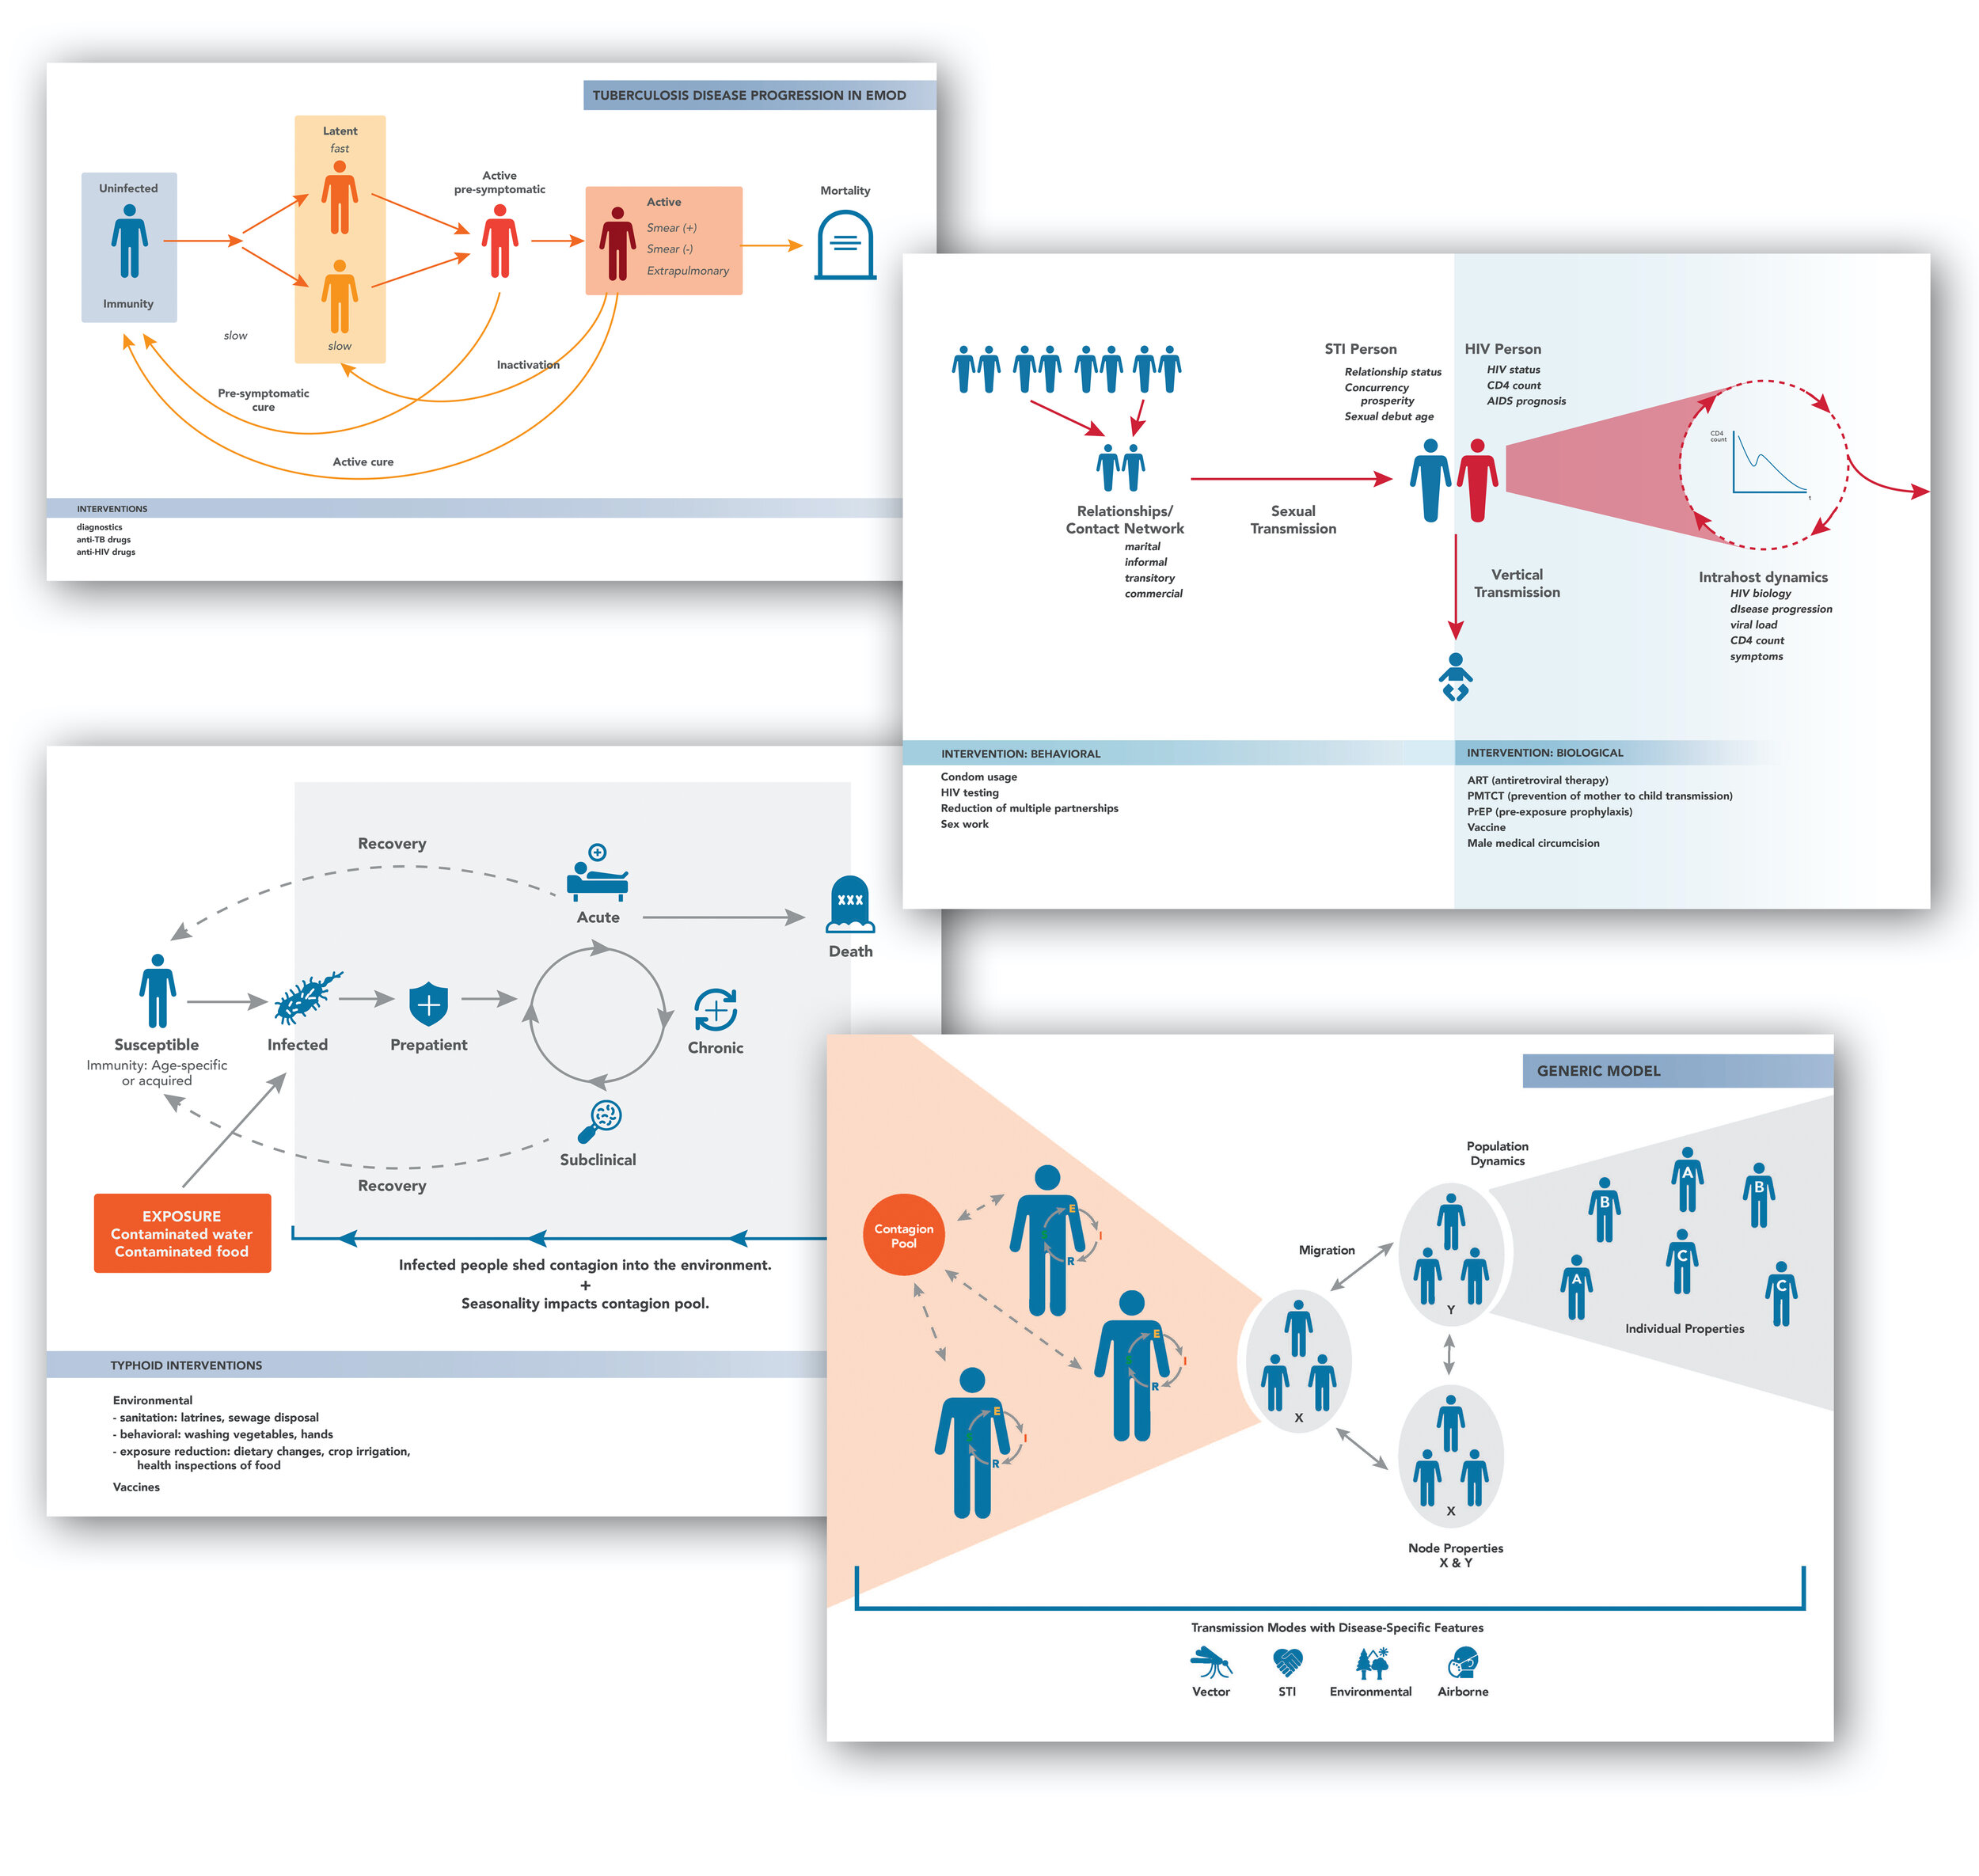
I created a series of flowcharts explaining the Institute for Disease Modeling's Epidemiological MODeling software (EMOD). EMOD is a highly customizable online program and allows users to add various interventions to their disease simulation, such as antimalarial drugs that can be specified to target certain populations of humans or mosquitoes. Further, the model can also take into account transmission intensities, mosquito behavior, and seasonally-driven ecologies. The series of graphics have helped established a visual language to use across the Institute for Disease Modeling's software documentation, as well as their scientific research papers.
Related Presentations
“Information Design for Scientific Research” Invited talk at Dahdaleh Institute for Global Health Research, York University, Toronto, Ontario, Canada.
“Scientific Information Design Best Practices” at MAKE: AIGA Design Educators Conference.
“Case Study: Disease Modeling as an Interdisciplinary Practice,” at CONVERGE: AIGA Design Educators Conference.
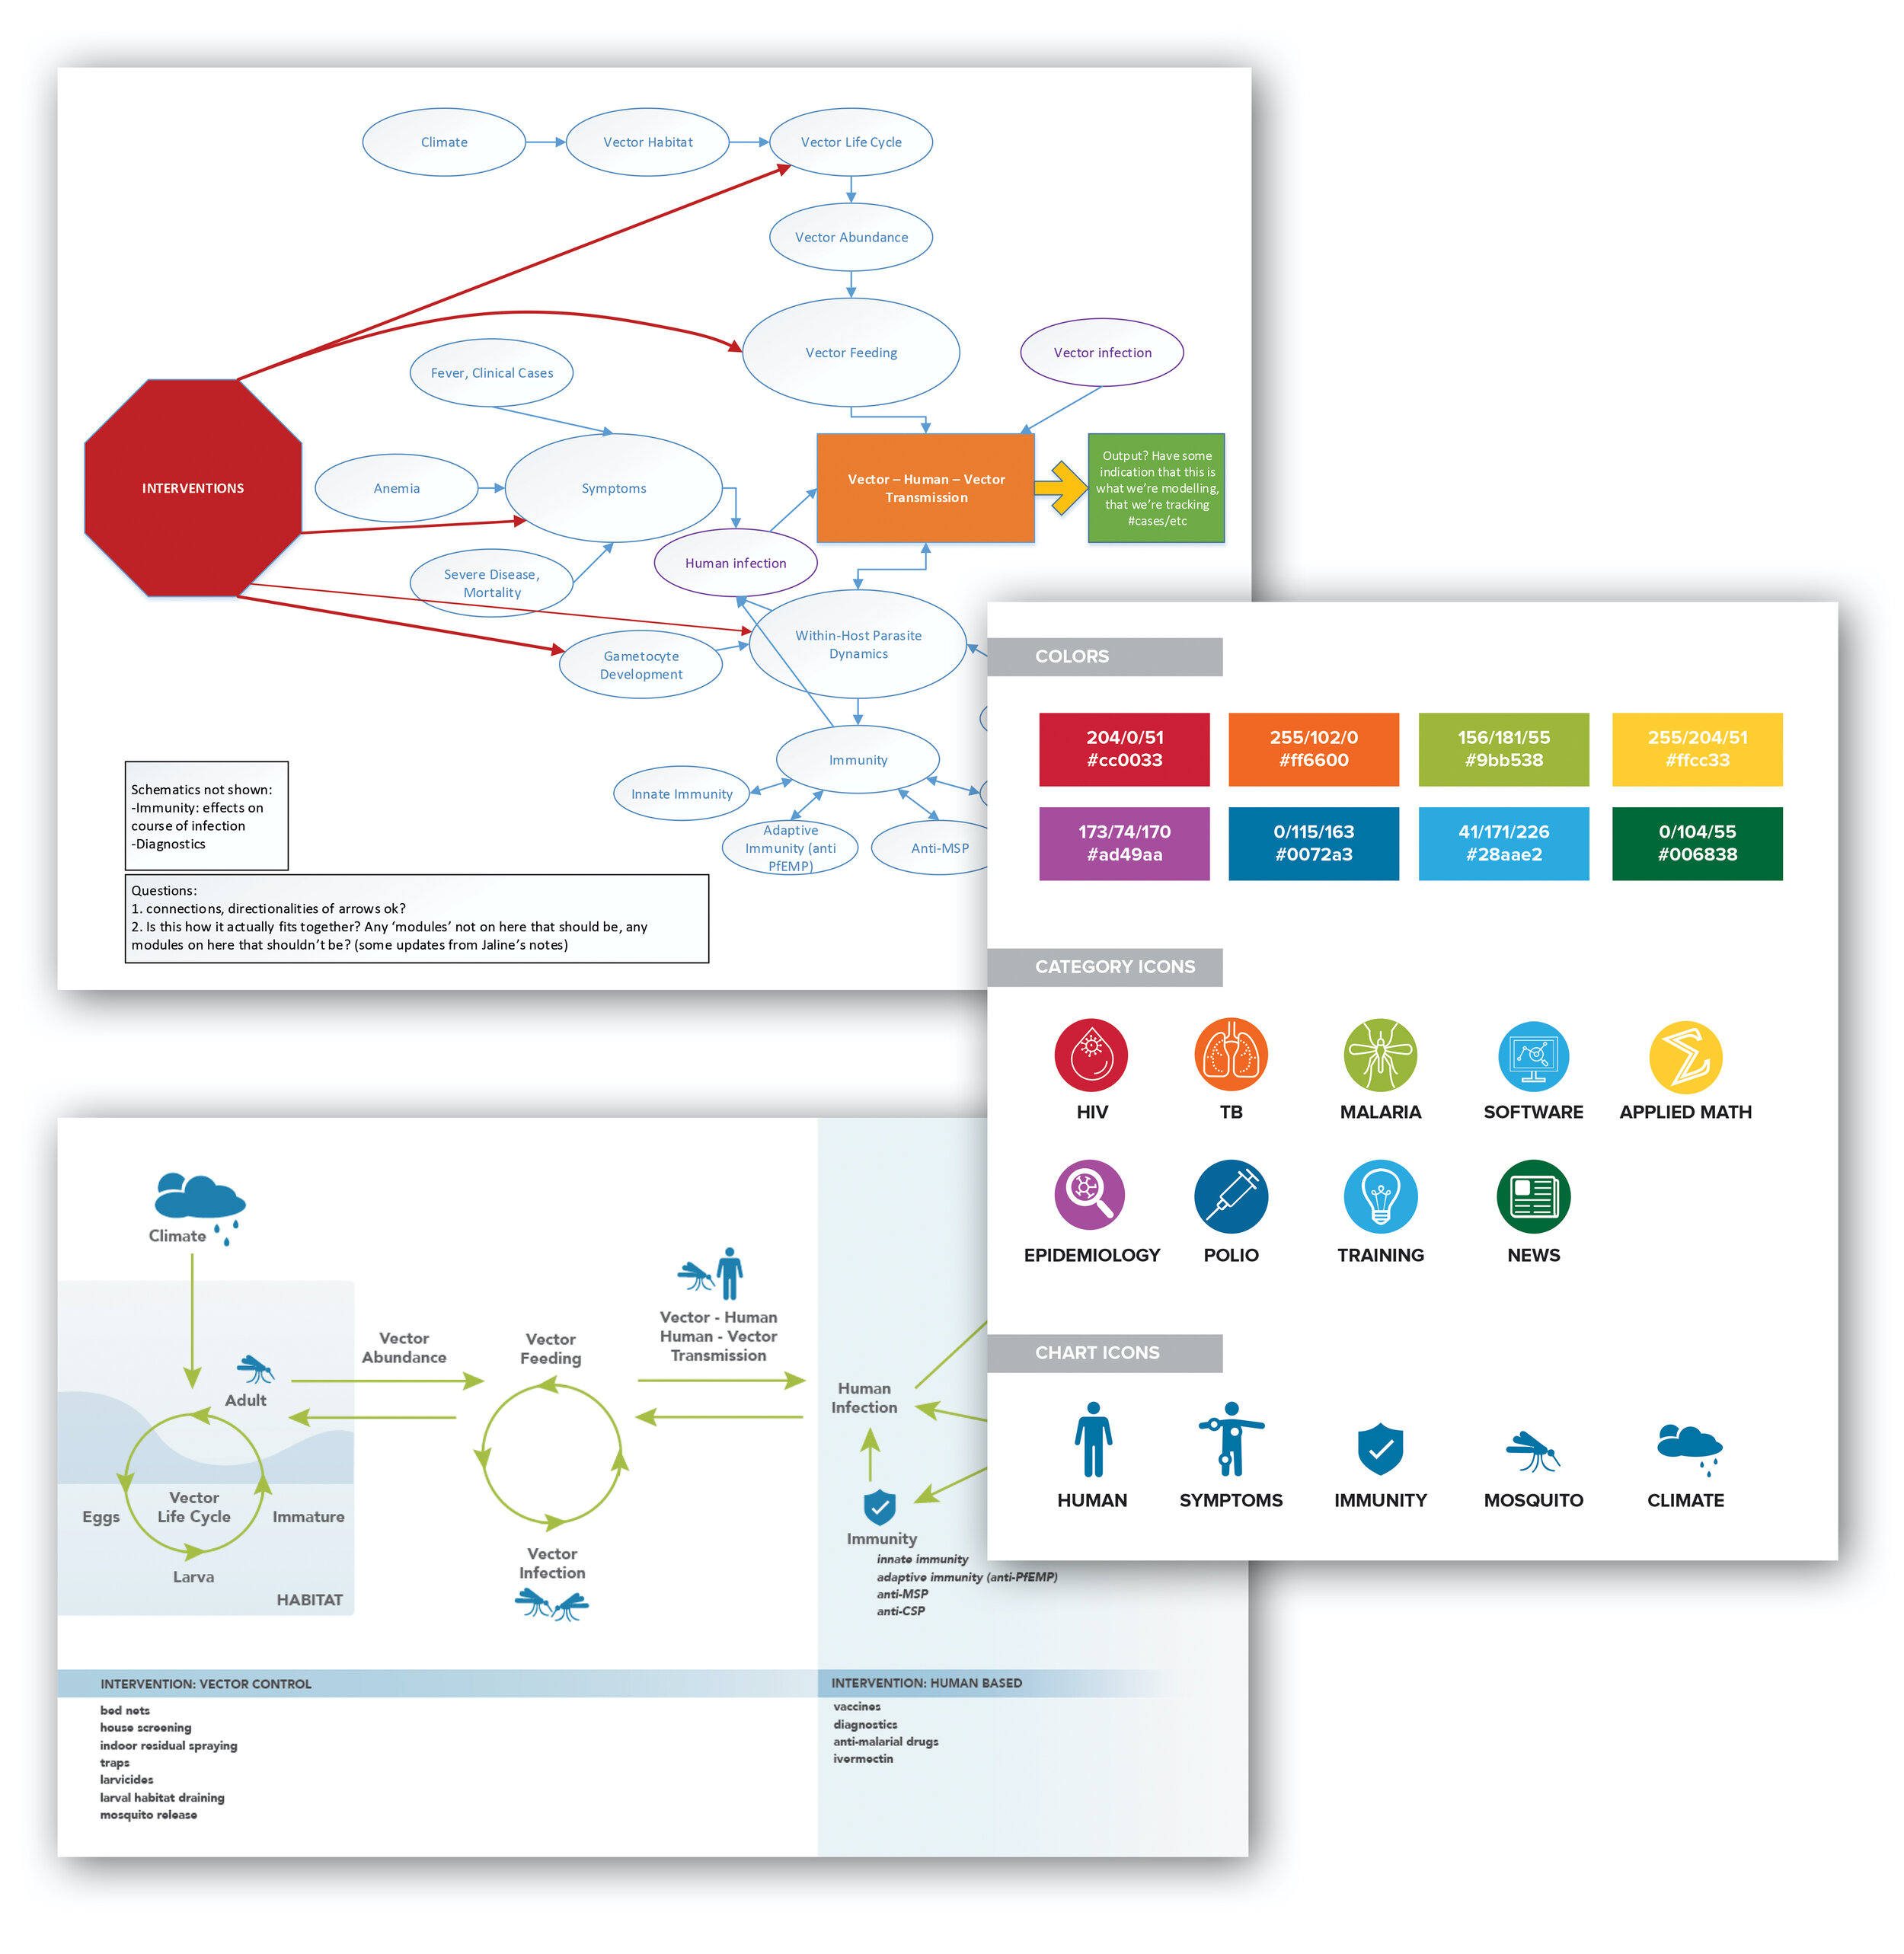
Original flowcharts that are handed over to me (top) are given a consistent visual treatment to better organize and explain the content.